

Feature Launch: Rolling Averages
Feature Launch: Rolling Averages
Summary pages have new graphs based on what's gone into the weekly posts

J!ometry pages that summarize multiple games, such as the Regular Play Summaries, Tournament Summaries, and nearly all other summary pages now include two new graphs.
The first is the 5-game rolling average of Attempts and its breakdown into max, median, and minimum attempts per player for each game, which is the basis for the attempt data summaries I’ve been posting here each week. This has been a consistent enough feature that I’ve promoted it to the site.
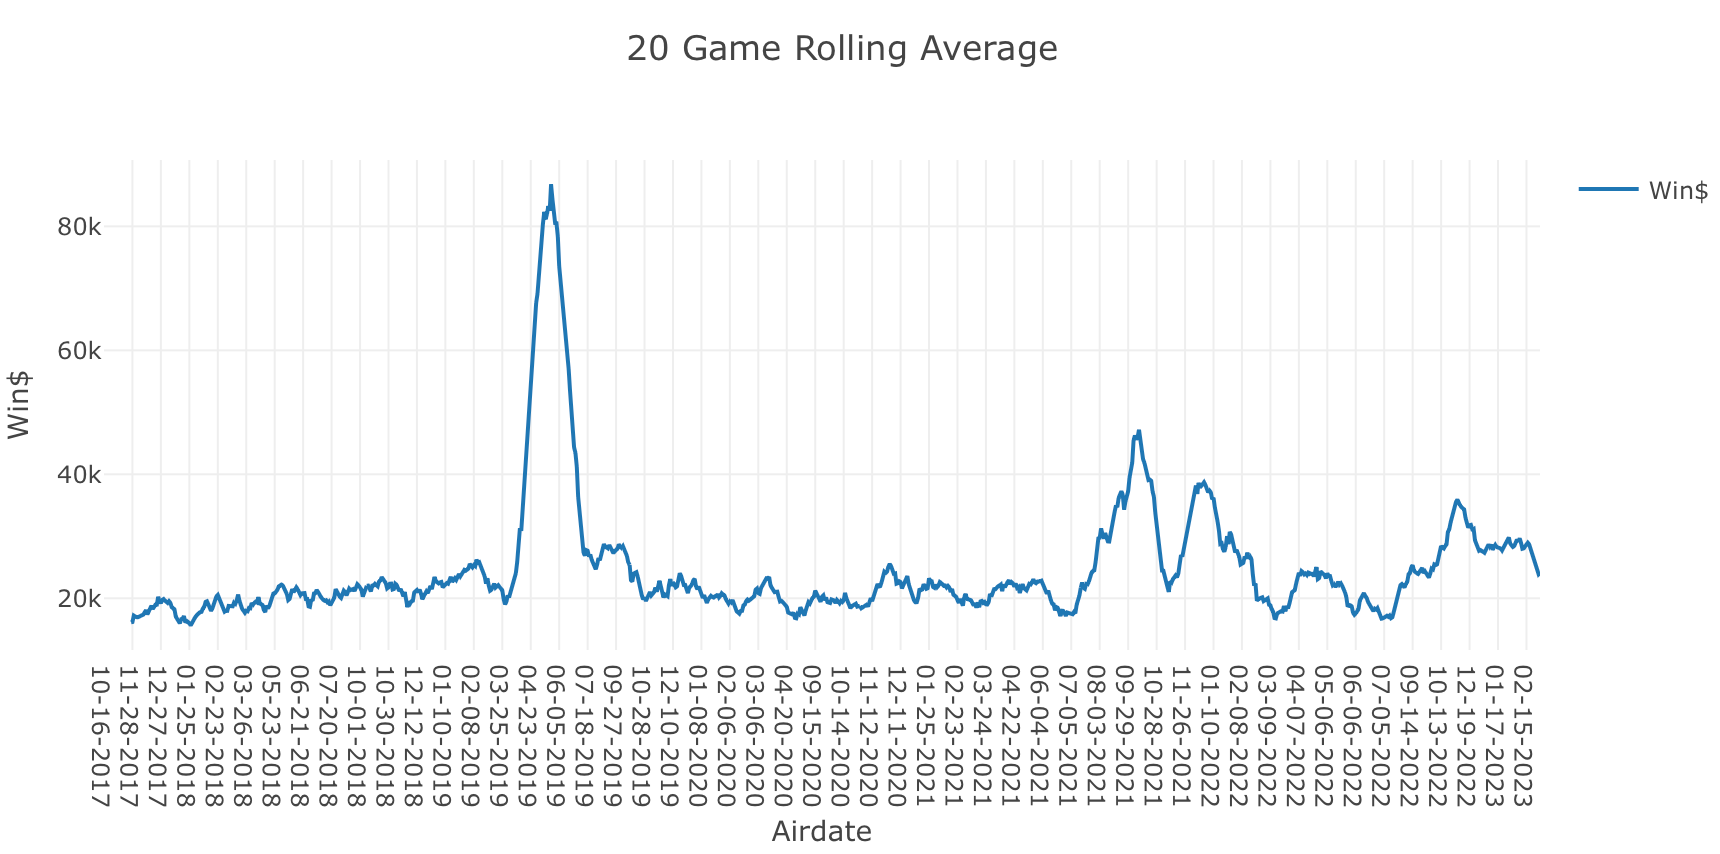
The second is a customizable rolling average graph, which allows getting the 5-, 10-, or 20-game rolling average for selected game level statistics, such as total attempts, total buzz score, contention, and winning score.
These are on all summary pages for now, but they’re most applicable to the regular play summaries and regular play season summaries, as the flow of the game is really more applicable to rolling averages than a tournament setting is.