


May and June 2023
Winnings, buzzing, and attempts all hover at low levels

In case you don’t read Substack Notes, or missed the one I posted near the beginning of June, I was on a long trip going to 30 MLB games in 30 MLB parks, one each day, for 30 days. I did this successfully! There were some close calls, particularly with air quality issues in the Northeast and a long security line at SeaTac Airport, but we made it to all thirty parks as planned. And then I fell asleep and have been slowly rejoining my normal life already in progress.

One part of that is J!ometry. I started pushing data updates to the site again in late June, and so it’s fully up to date. I haven’t yet returned to model and code updates, and that will probably fall into the break between Season 39’s end and whenever Season 40 starts.
Trending This… Month?
Hey, it’s been a while. Let’s get a decent look at the game trends. Note that most of these graphs are available for you to peruse on j-ometry.com. Based on my absence, we’re really going back to when Ben Chan’s streak ended on May 23. If you’ve thought that the games have had lower winnings since then, it’s not just you. They have.
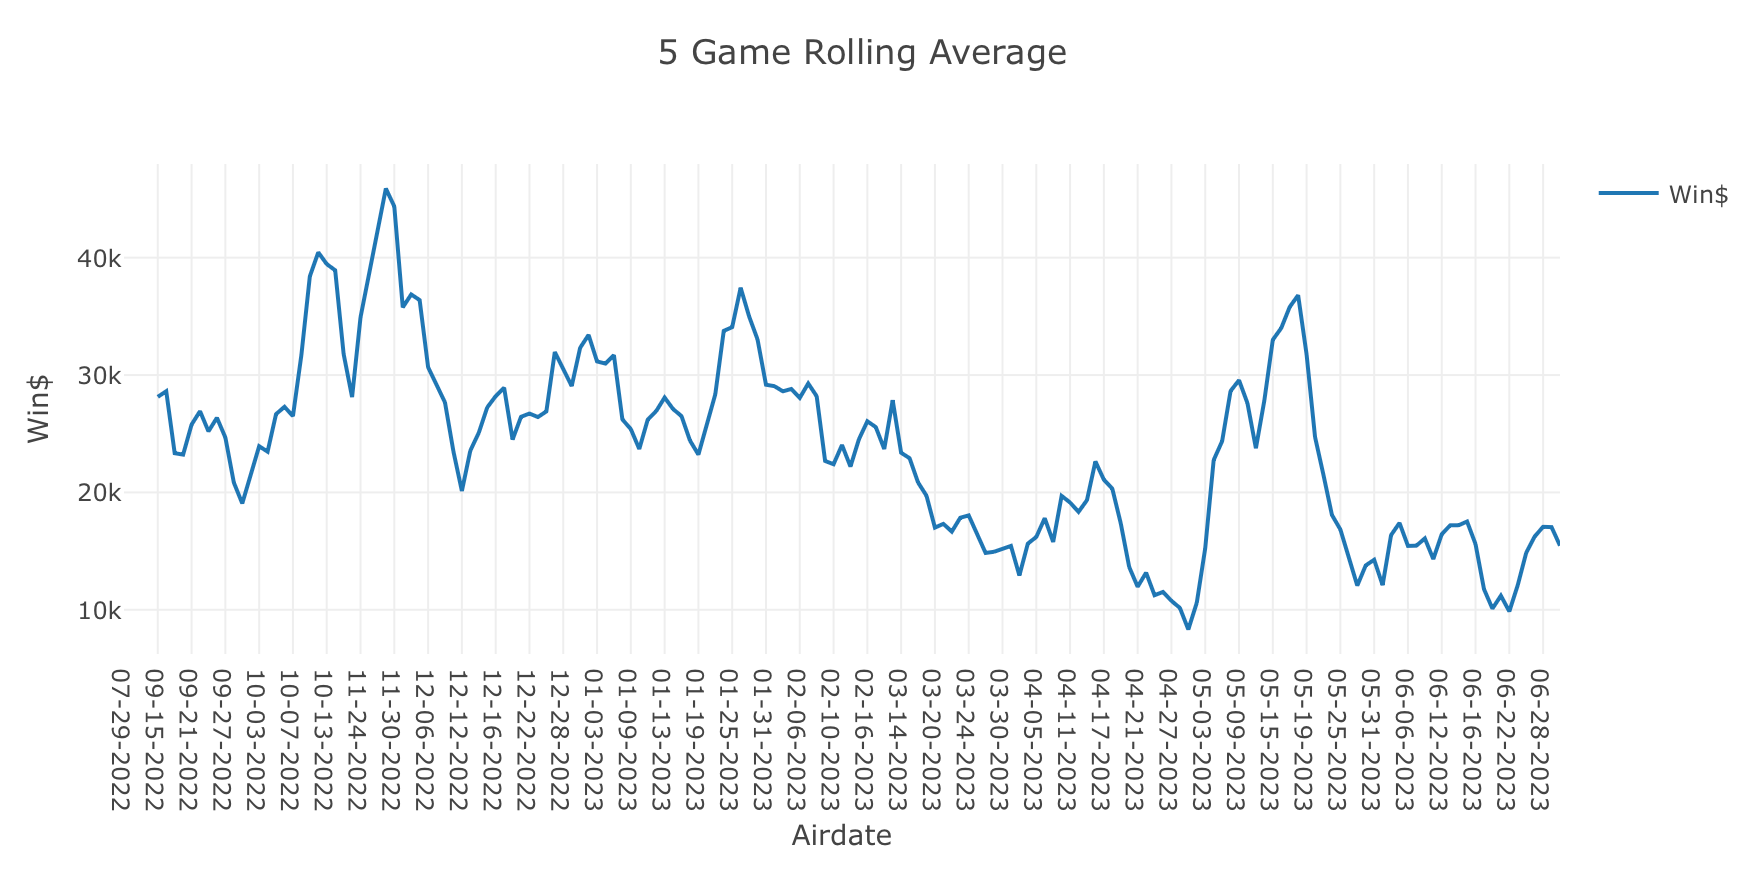
It may be more accurate to say that Hannah Wilson and Ben Chan caused a spike against the background of lower winnings, though. Aside from the two of them, average winnings have been near or below $20000 since spring started.

Attempts are generally down compared to the first half of the season, but they’re in line with the level from the second half of season 38. Hannah Wilson and Ben Chan drive a small elevated region, but we’ve had runs of games where the lead attempter is averaging under 40. It’s impossible to know if this is due to more difficult material (either directly or through clue interpretability) or differing contestant ability or aggression. Given the nature of the shift from low to high to low, I wonder if there’s something in the production calendar that drives the change. We’d need at least another few years of data to have any confidence in that, but it’s an interesting thought to me.

I think the trends of BuzC$ (the total money earned on correct buzzes) argue in favor of something in the material being different. That’s because the second half of the season has been steadily lower than the first, even during high-scoring streakers’ streaks. Hannah and Ben C. scored a lot more than their opponents, but they didn’t drive a change in the total score in the buzzing game. The buzzing money was distributed towards them, but it wasn’t a larger pile of money.
Of course, although we don’t have box score data from before 2021, BuzC$ is calculable from J!Archive data, and not all seasons trend downward. Seasons 39, 38, and 36 seem to. Season 37 trends up but had so many different hosts and pandemic conditions that it’s probably meaningless. However, season 35 and 34 look like they trend upward as well.
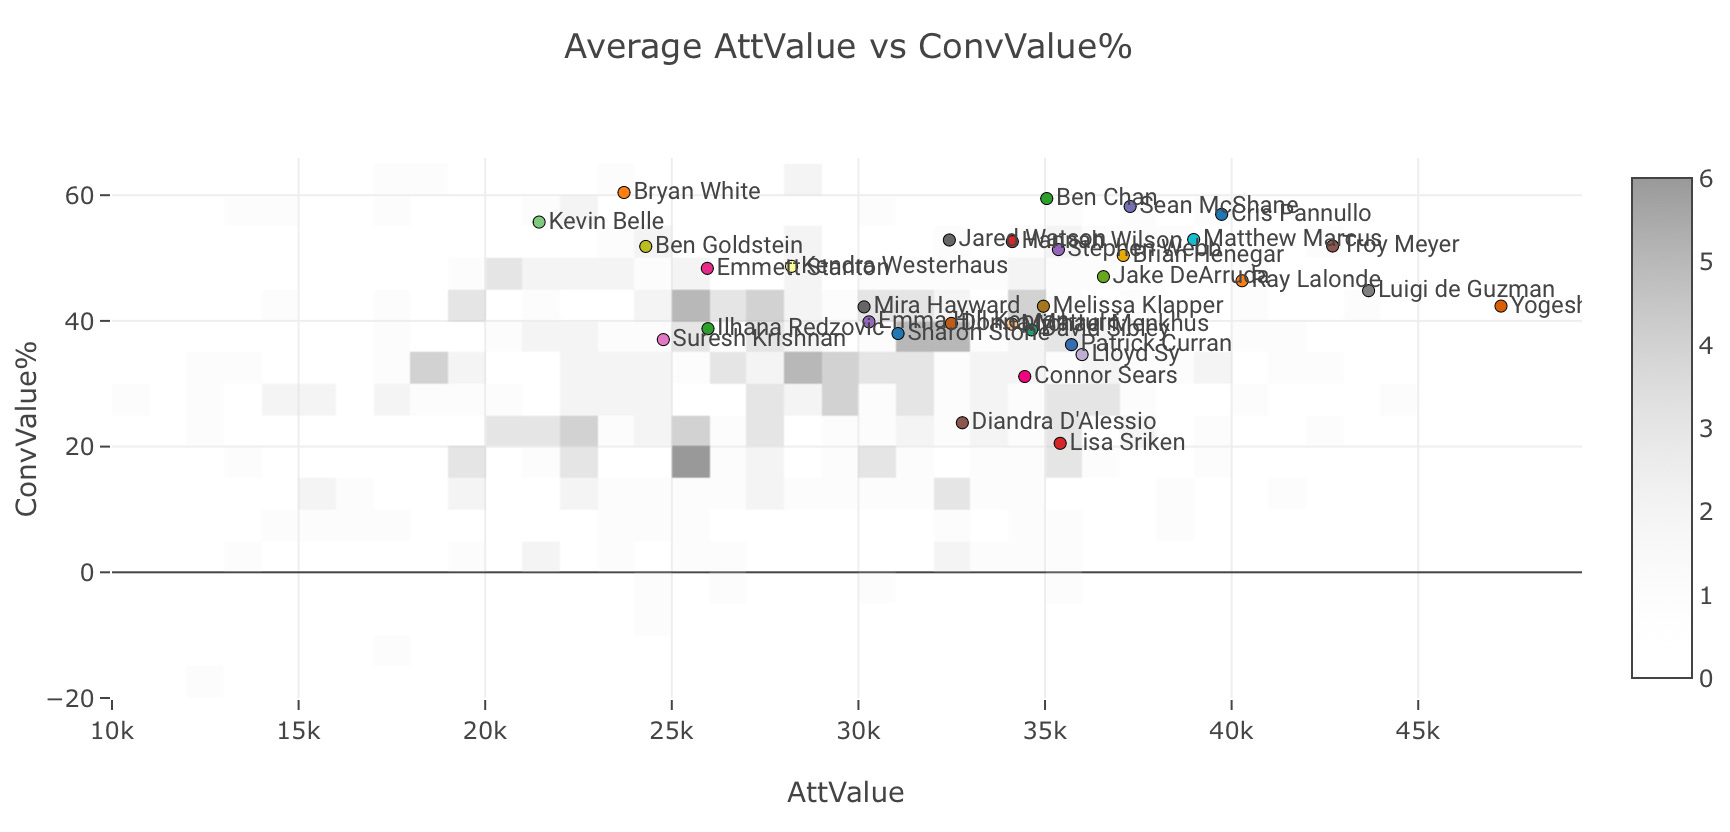
The lower attempt rates overall mean that late season 39 champions have had to convert well. TOC qualifiers Suresh Krishnan and Ben Goldstein, as well as other recent multi-game champions, are farther left on this graph than the cluster of champions from earlier in the season. Most of them convert at a high rate compared to similar attempters. I think this is a second-order effect of attempts being low: contention is also going to be lower unless the contestants overlap in both knowledge and knowledge gaps, providing the opportunity for high conversion. This change in champion distribution is something different from season 38, where most multi-game champions remain to the right and no one has an unusually high conversion combined with low attempt value.
Coming Up
The remaining month of season 39 has Ken returning to host. These episodes were filmed after the start of the WGA strike, so there’s also no one on set as a writer. Both of these things may make a difference in the gameplay, so we’ll see what happens.