

Precap: SCC Week 1 Day 1
Precap: SCC Week 1 Day 1
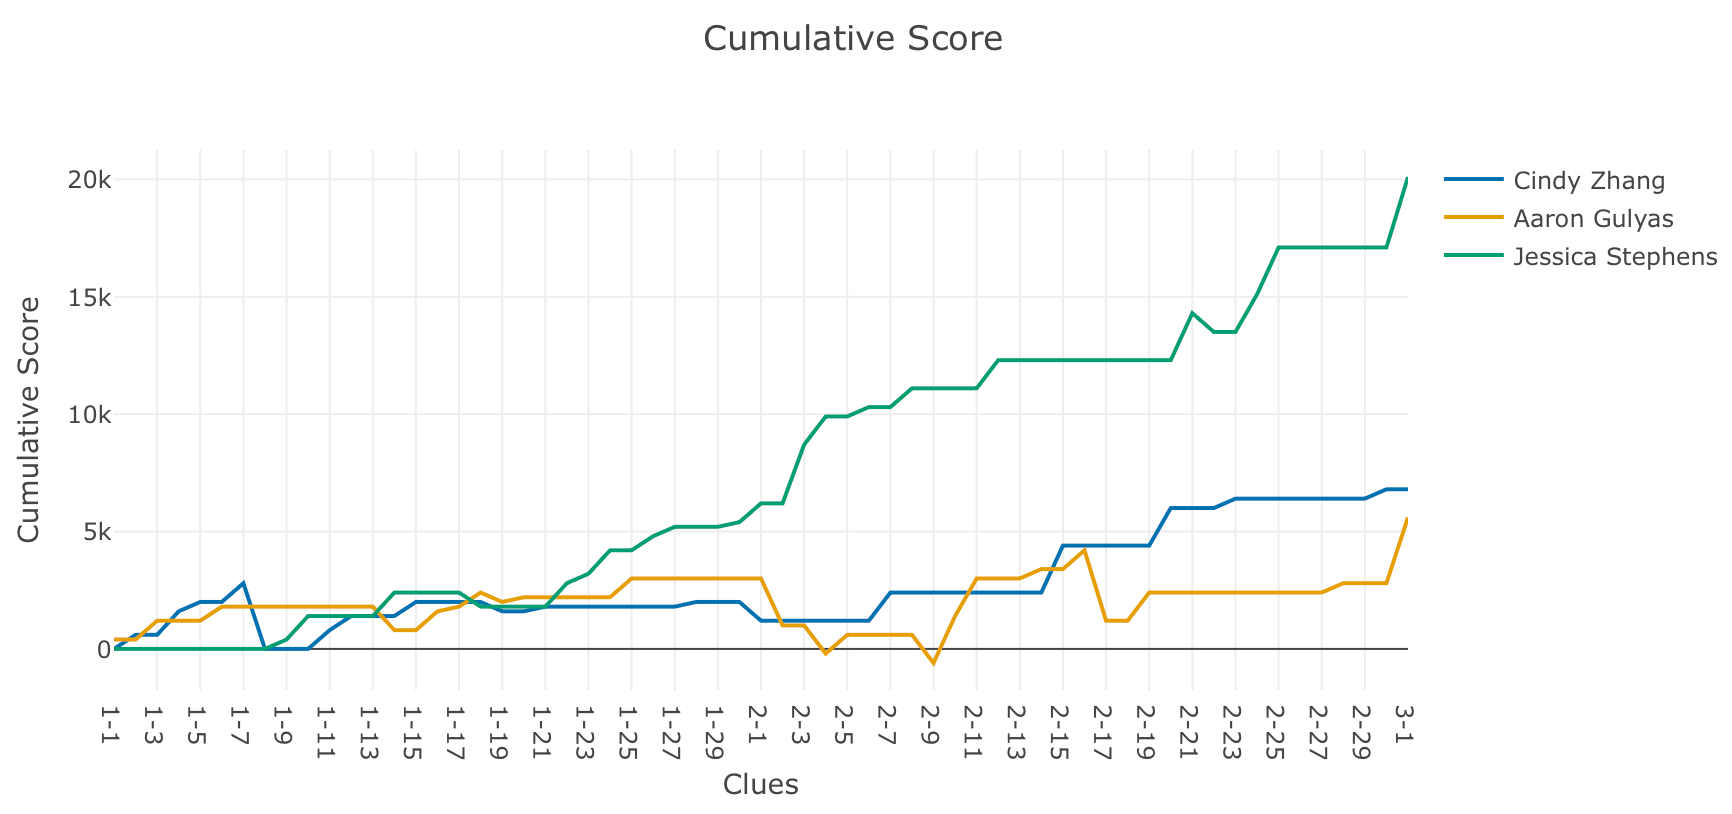
Cindy Zhang v Aaron Gulyas v Jessica Stephens

I’m trying something out here and we’ll see if it works. And more particularly, if I keep up with it, though I can write these in advance and maybe that’ll help.
With work and travel and also being much less isolated these days, my work on updating the J!ometry website with output from my updated model and data structure have stalled for a couple months, but something I do have is the output for all of the games that are airing as reruns. I’m a more than a little intrigued to see what the viewing experience is when the statistics are already there. It’s more like looking at game film.
Many of the graphs I’m posting in this series aren’t yet available on this site, but I’ll likely return to that with the remainder of the summer. Note that because this is a full update, model output numbers will not match what is currently on the site. (Direct game data should match.)
Game Precap
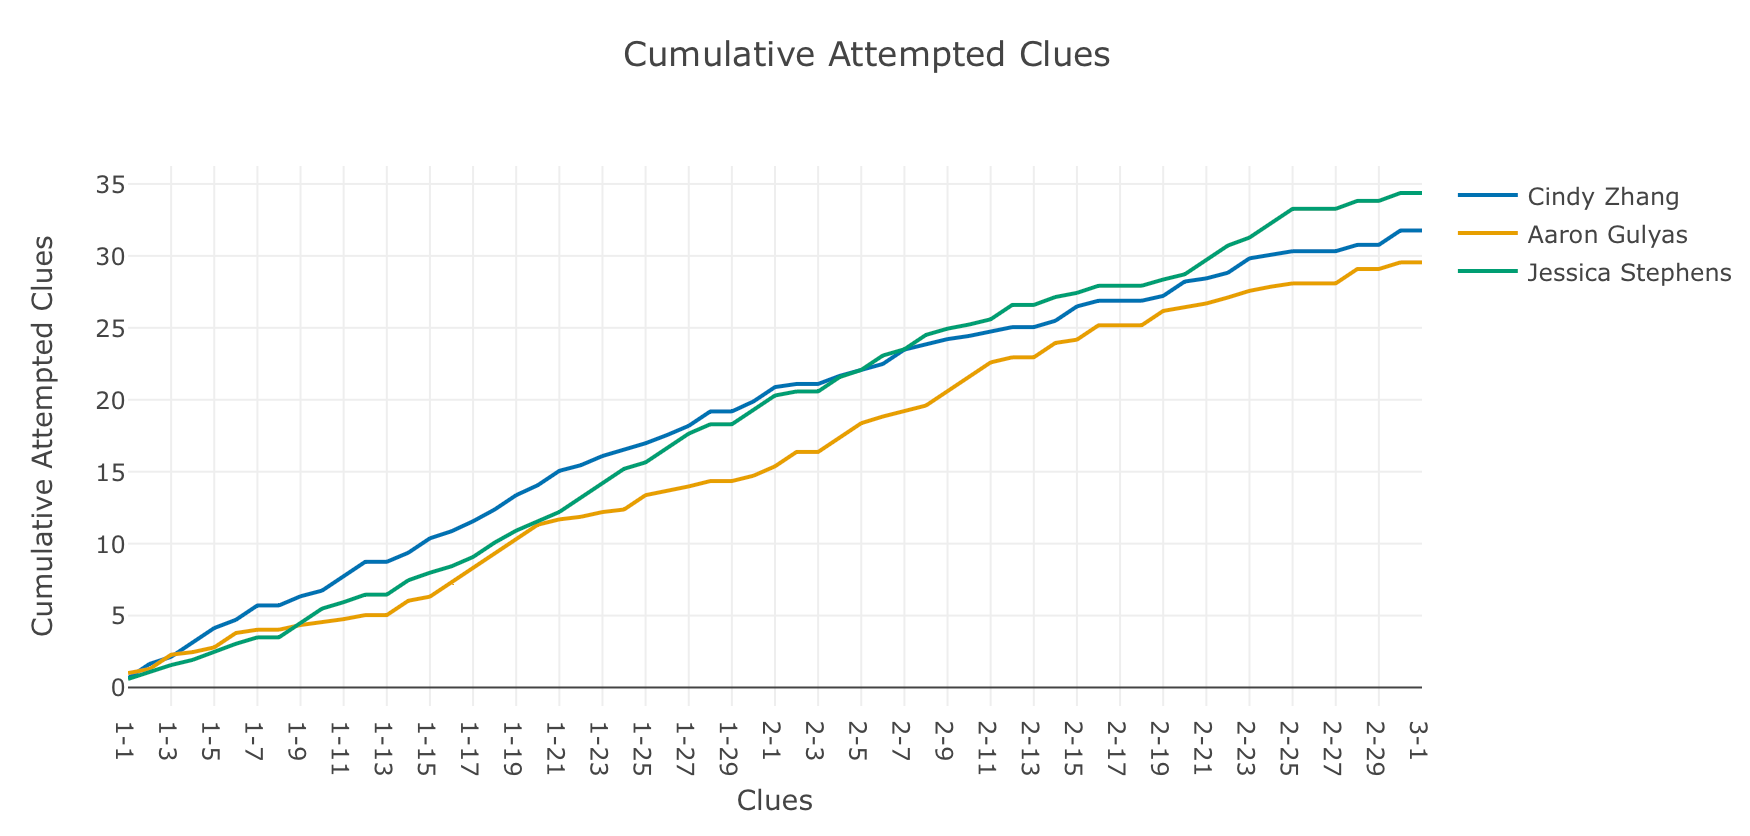
One of the updates I’ve made is that there’s an explicit separation of “attempts” (the actual number from the box score) and “attempted clues.” The latter is an estimate that removes double- and triple-counting for clues on which a contestant may have made multiple attempts. In this game, Cindy attempts on more clues in the J round, while Jessica pulls ahead in DJ.
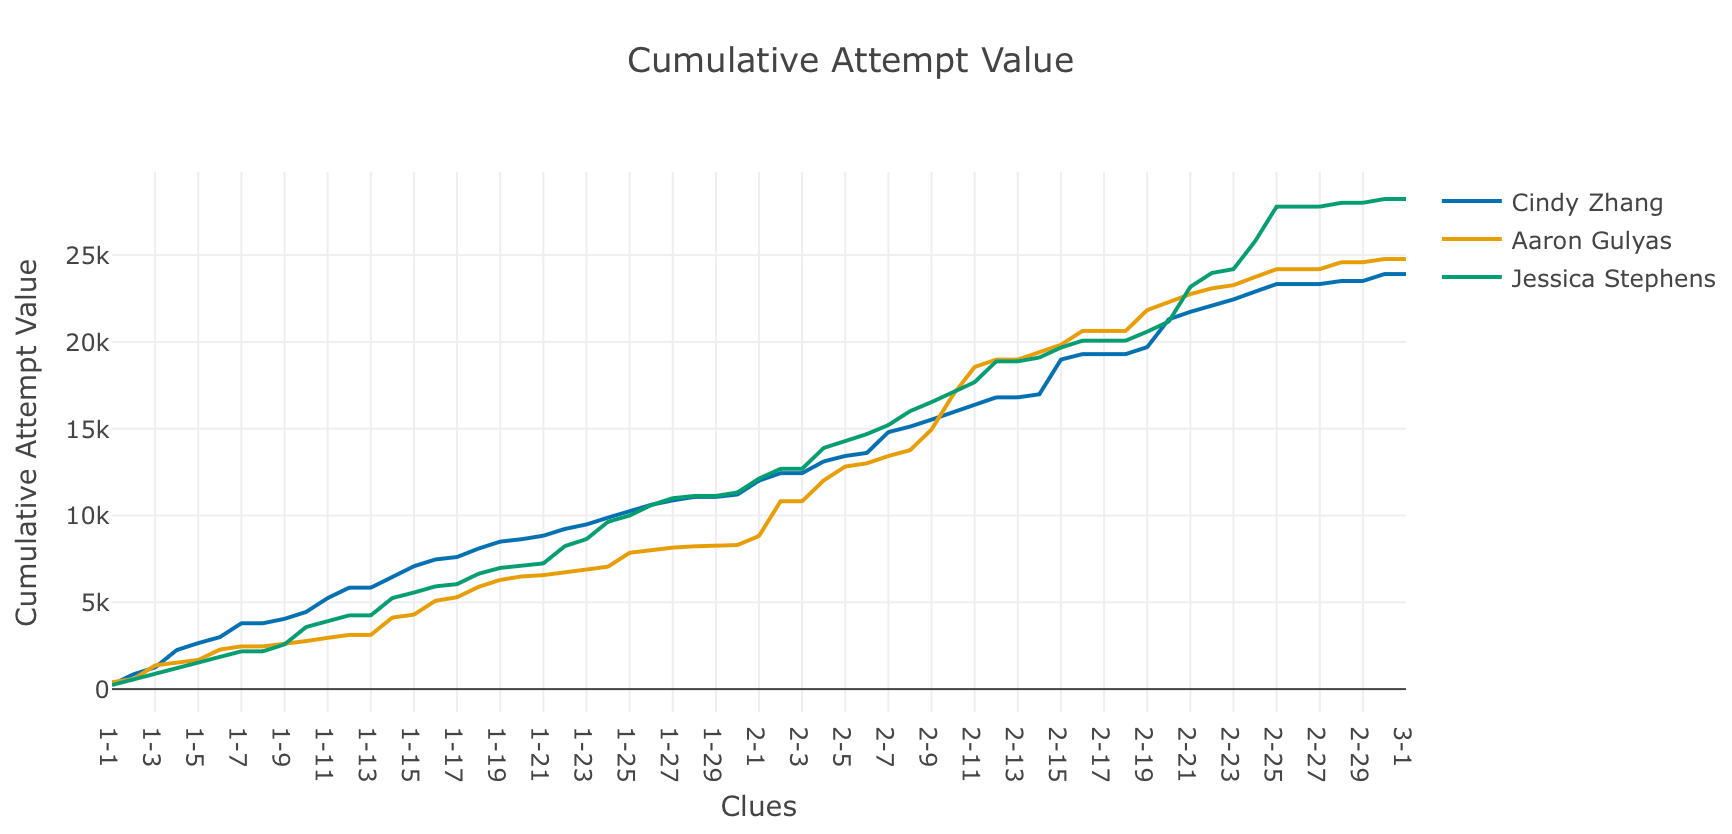
Attempt value now also accounts for double- and triple-attempted clues by only counting the value once for the estimated repeats. Cindy’s attempt edge in J is still visible, but now both Jessica and Aaron pass her in DJ, reflecting both the higher value of clue and their known buzzes at the bottom of the board.

Value of buzzes makes clear the shift in who’s getting in throughout the game. Cindy gets in most early, but Aaron and Jessica both now meet up with her before the J round ends. Aaron gets in a lot for the first two-thirds of DJ, but Jessica picks up a lot of buzz value late in the game.
Basically, Aaron figured out his buzzer timing after the first commercial break and got in on a lot of clue value that the others were also attempting on.

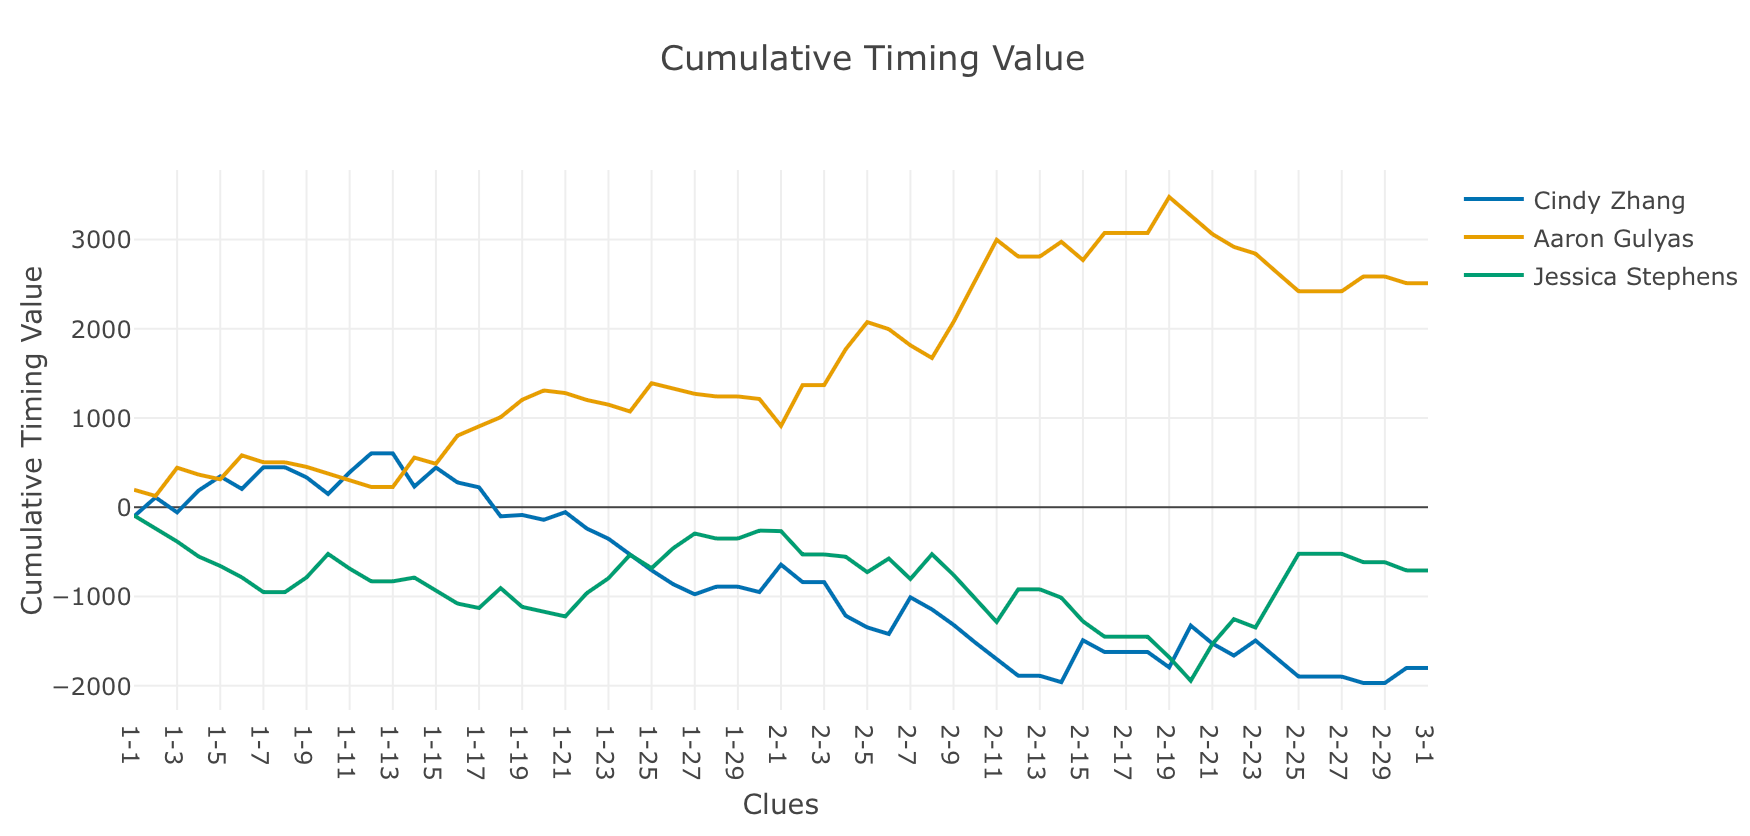
Timing score can be unintuitive, because if you don’t get in, you get $0, so bad timing does not necessarily result in bad timing score. What it does show, in comparison with the previous graph, is that Aaron wins the race to buzz in a lot in the first half of DJ, but incorrect responses wreck his scoring.
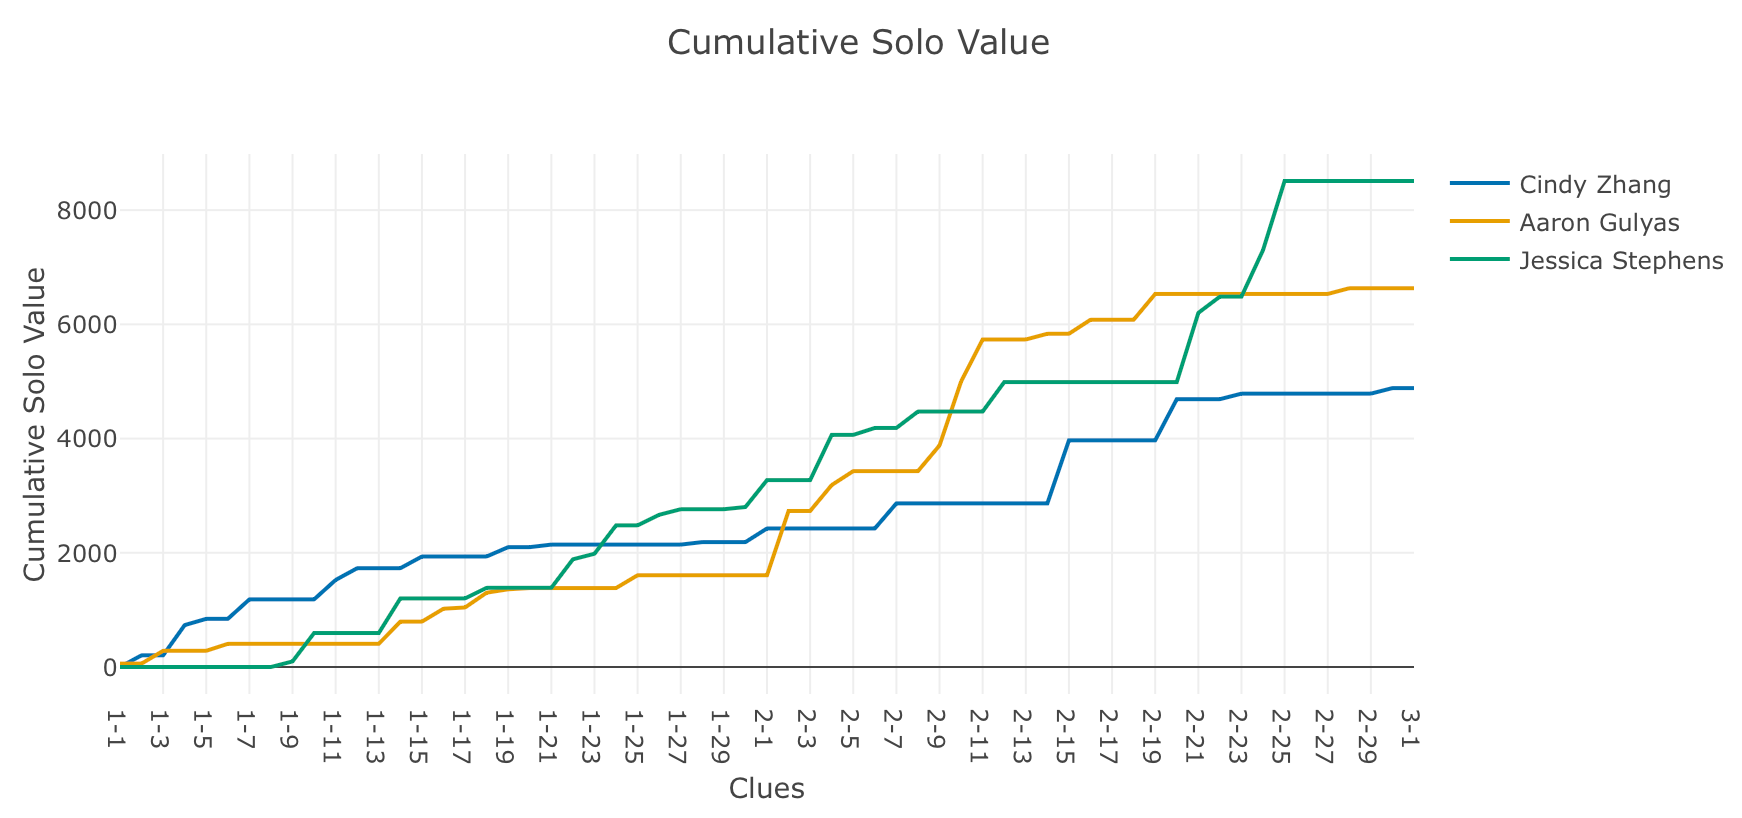
Meanwhile, on the solo side of things, Jessica pulls a lot of late value by herself. We already knew she had more attempts than her competitors, particularly in DJ, but this highlights how that worked out. This was at about when she locked up having a runaway.

Jessica’s dominance and correctness in the solo game come through in the solo scoring.
The overall result is that through picking up Aaron’s rebounds early in DJ and getting her own solo scoring done in late DJ (along with a DD get and Aaron’s DD miss), Jessica put together a strong performance that put her through to the week’s final.
Let me know if this proves interesting as you watch! Or especially if it ends up feeling inaccurate to you. It’s all new! It can be anything.