


Where Do Contestants Come From?
Using Matt Carberry's data to look at the geography of the contestant pool and how the pandemic and Anytime Test (and probably just chaos) have shaped it

Geography… J!ography?
Where do Jeopardy! contestants come from?
I was recently in a conversation about that, wondering if some geographic areas are over- or underrepresented among Jeopardy! contestants, and if so where. There’s some pretty easy guesses. Washington, DC, seems to come up a lot, and for logistical reasons the show needs to keep a set of Californians at the ready. Beyond that, it’s easy to fall into gut checks and intuition, but there’s no need. We’re going to look at some trends in the data Matt Carberry has been collecting since season 33 of contestants by television market. Thanks to Matt, by the way, for both collecting it for years and signing off on me using it.
Here’s a base example of how I’m going to describe representation. In season 39, there were 17 new contestants from the San Francisco-Oakland-San Jose market. As defined by Nielsen, there are 2,593,210 households in this market, so there were 6.56 contestants per million households. Meanwhile, there were 361 new contestants from the United States (not counting Puerto Rico, which is not included in the same Nielsen market structure) and 123,785,250 households, so there were 2.92 contestants per million households nationally. The Bay Area market gets a representation ratio of 6.56/2.92 = 2.25, or 2.25 times the “expected” number of contestants from the national sample. Note: I am using the latest household count in all cases, even though it updates over time. As usual, we’re into estimation territory and I’m not going to stress about that too hard.
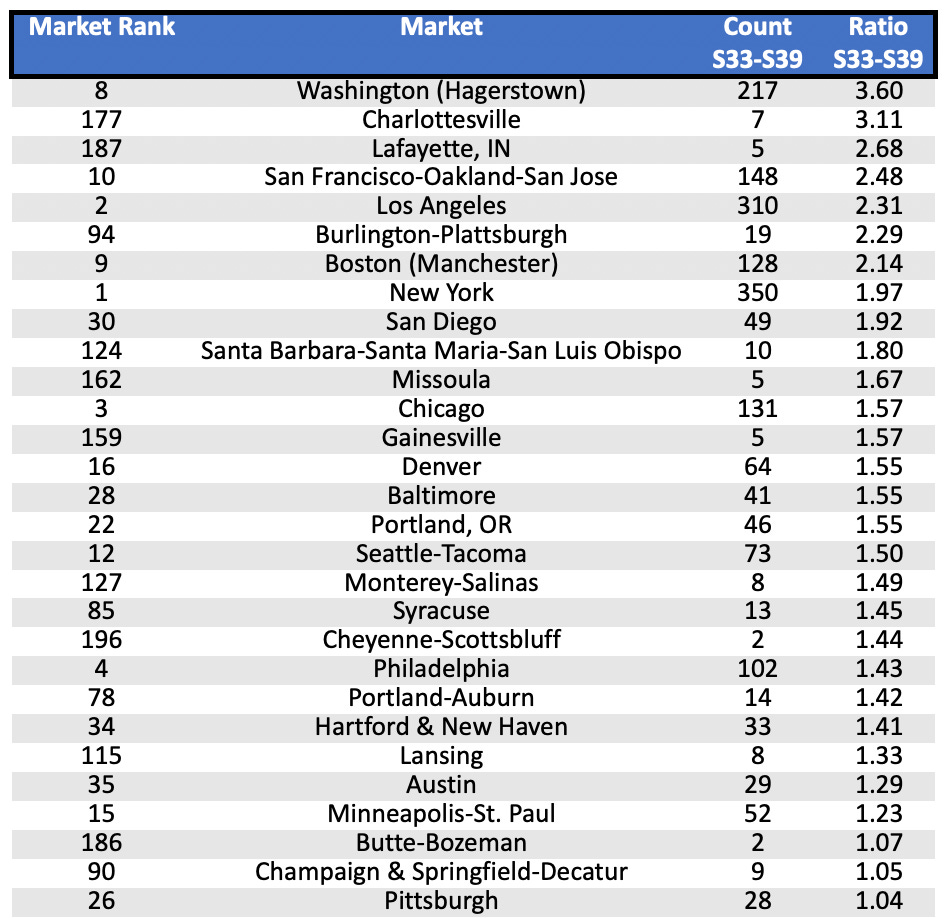
Ranking the markets by that ratio, Washington, DC, comes out on top by a large margin. The Californian markets of San Francisco, Los Angeles, San Diego, Santa Barbara, and Monterey all rank near the top. But also highly represented are some college towns. It’s hard to know exactly where to draw the line on what is a “college town” versus a “town with a college” but you would definitely include or at least consider all of Charlottesville (Virginia), Lafayette (Purdue), Burlington (Vermont), Missoula (Montana), Gainesville (Florida), Syracuse (Syracuse), Hartford/New Haven (Connecticut/Yale), Lansing (Michigan State), and Champaign (Illinois). It’s likely also a factor with the larger cities in the list, though subsumed into the greater urban fabric. We’ll come back to college towns farther down.

I actually found it really surprising a California market came in last here, and not exactly a small market with Fresno — but it does fit in with overall less urban, less centralized feel at this end of the ratio list. This list generally skews more to the South, especially when looking at which larger markets are here: Tampa Bay, San Antonio, Greenville-Spartanburg, and Jacksonville. It is beyond what I’m going to do here, but I would be really interested in seeing how this list matches with Jeopardy! ratings in each market, and how those ratings correlate with income, race, education, English language in the home, and if Jeopardy! airs at a weird time in that market. (No big project, I’m sure, right?)

Now, there are some notes for this dataset, and they all hinge on season 37.
The covid-19 pandemic shut down season 36 and changed contestant procurement in season 37 in order to deal with travel, leading to more contestants with easier access to Los Angeles.
The show reintroduced announcing players as “originally from” locations in season 37 in order to regain some geographic representation lost to travel necessities.
The Anytime Test had already been introduced when the pandemic began, but just barely. Season 37 includes the first contestants to go through the Anytime Test itself and a Zoom-based audition process.
Notably for me, I hit all of these. I was a season 37 contestant, available because I live in Los Angeles, announced as originally from El Paso, and who took the Anytime Test in February 2020 and was interviewed during that summer. Subtract me from El Paso’s count and it falls into the bottom four in ratio, likely related to it being a poor and heavily Spanish-language market.
With these changes in mind, I want to look at how the representation numbers changed as well.

Although several Californian and other western markets have a rise, the top of this list was not as focused on the West as I expected. I do suspect that the “originally from” introductions bear a portion of responsibility for that. Even with that as an option, Los Angeles still had an announced ratio of 4.74 in season 37, San Francisco had one of 4.36, and San Diego and Santa Barbara were each over three, so without it there should have been even larger ratios for western cities. These spikes have faded through seasons 38 and 39, though they usually remain elevated compared to before the pandemic. Otherwise, I don’t really see much pattern in what more distant markers gained contestants.
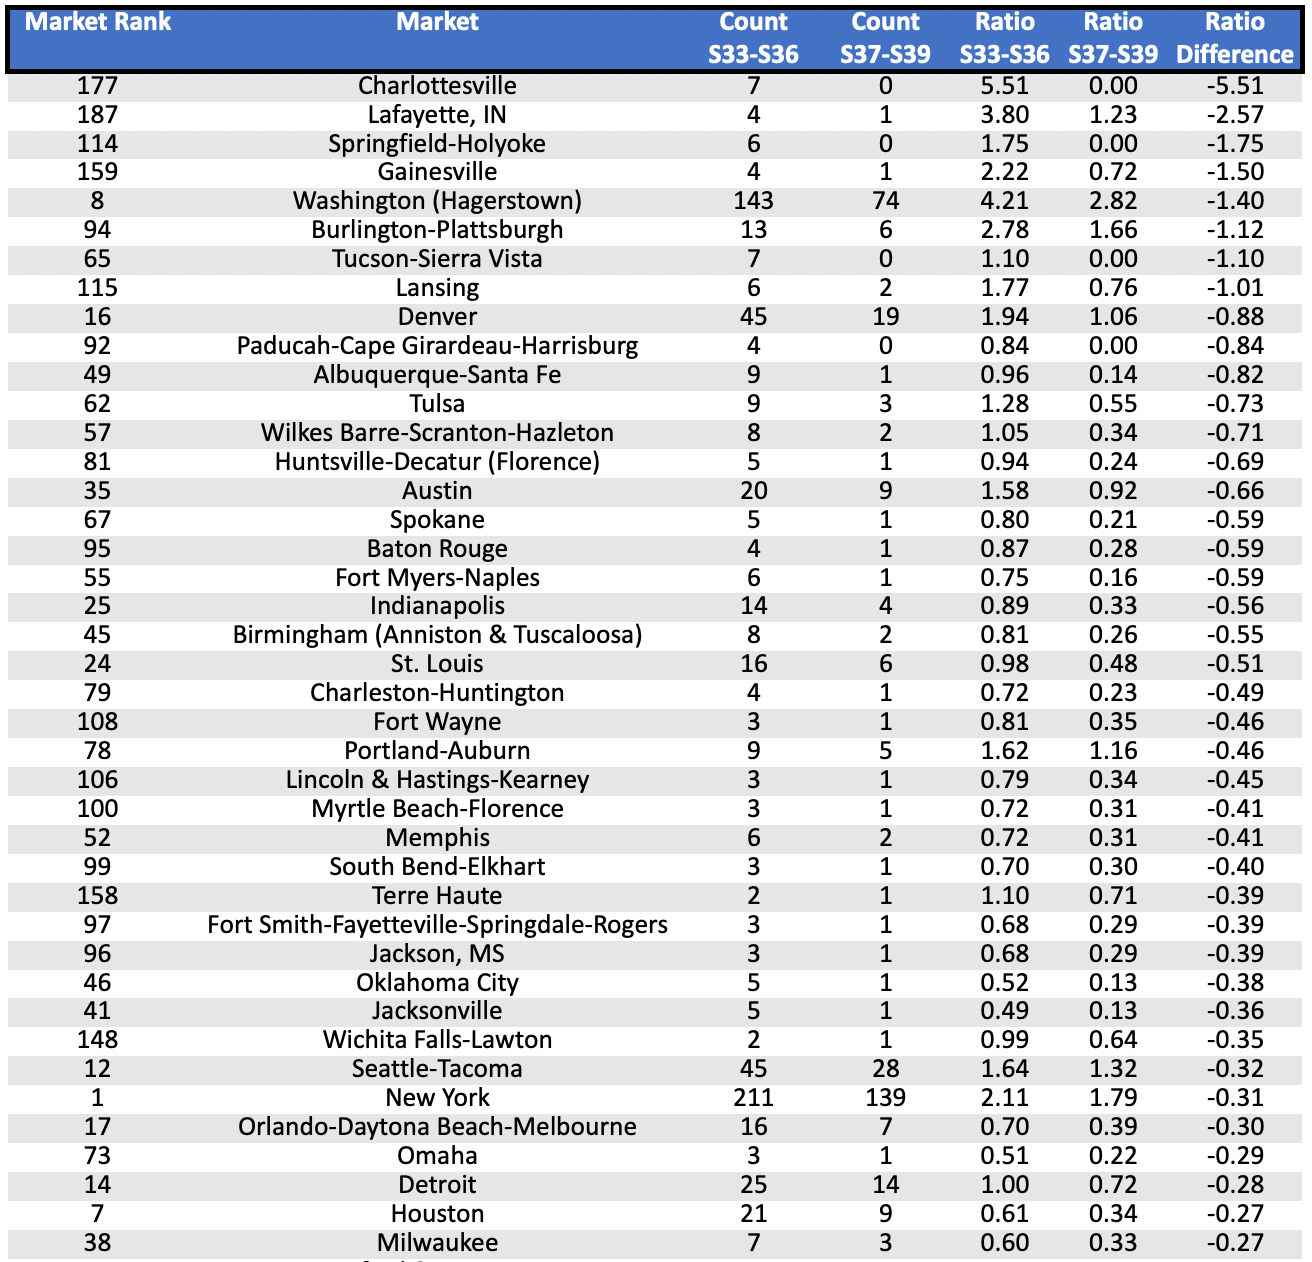
This is where we come back to the college towns, because some of them have just been wiped out. Charlottesville had enough contestants earlier to have the second-highest ratio for all of seasons 33 to 39 but has had no contestants since the start of the season 37. Lafayette and Gainesville have had one each in three years. Springfield-Holyoke, home of a cluster of colleges in western Massachusetts, has seen a similar fall to zero.
Now, this isn’t happening to all of the college towns or college-oriented cities that I listed up above. Syracuse and Madison, for example, are in the previous list as gaining. As I was playing with these numbers, this dropoff of college towns struck me originally and that’s what I set out to write about. It felt like there should be a coherent story to that, that perhaps in-person testing and auditioning created small nodes of contestants out of high-density environments like colleges, and then the pandemic and the Anytime Test removed some of the supports that nurtured that pocket of the contestant pool. Instead, there’s more of a story of volatility, as complex human processes interact with other complex human processes in complex ways.
To a certain extent, like the entire project of J!ometry, this writeup is the equivalent of me doing the Marge Simpson “I just think they’re neat” meme. There are certainly patterns in the data, but I don’t have as strong an idea of how to hypothesize on the movements besides what I’ve already written. Markets like Seattle and Denver going down or Kansas City and Norfolk coming up feel more like regression towards a mean than anything. Maybe there is something to how the audition process’s changes work around colleges, but it’s had different effects in different areas. Maybe there’s residual effects from where in-person events were held before 2020, and where they’re starting to be held again. But I do think it’s neat, and sharing that so other people can make ideas too is part of what’s neat about it.
Second Chance
Season 40 starts next week with twenty-seven season 37 contestants returning for Second Chance. Season 37 predates the box scores, so I’m not planning to do a rundown of anyone statistically beforehand, but the summary of game data for these players derived from J! Archive is available on the site.
Very selfishly, I was hoping to see how the Canadian contestants factored in, COVID border closure time excepted, even if all lumped together (Jeopardy airs on one oddball national cable network and several unrelated regional broadcast affiliates, so it’s an odd mix).
Would love to see one on college contestants by school at some point.